Eurostat NUTS Boundaries Download — GISCO Shapefile
Quick answer: Download NUTS boundary polygons from Eurostat GISCO. Choose the classification version and level used by your statistics, then select Shapefile, GeoJSON, or GeoPackage. Join regional codes to NUTS_ID rather than matching names alone.
Choose NUTS boundaries that match your statistics
- 1.In the official GISCO download page, choose the classification year used by your statistics and the required NUTS level.
- 2.Choose the coordinate system, scale and file format. Use geographic coordinates for a straightforward web-map preview; preserve the downloaded metadata.
- 3.Inspect the NUTS_ID and LEVL_CODE fields. Join statistics using the regional code and matching classification version, rather than region names alone.
NUTS 2 map example: match regional codes before joining
For a regional choropleth, choose polygon geometry, the classification version stated in the statistical table, and level 2. Use EPSG:4326 GeoJSON for a geographic preview, or a Shapefile ZIP for a desktop GIS workflow. The map scale controls boundary detail; it does not change the NUTS level.
Filter the boundaries to LEVL_CODE = 2, then join the statistical table's regional code (often geo) to NUTS_ID. Keep codes as text and report unmatched rows. A region name, observation year, or similarly named column alone does not establish a matching classification version.
NUTS 0 usually represents countries, 1 major regions, 2 policy regions, and 3 smaller regions. See the official GISCO NUTS download selectors for year, geometry, format, scale, and CRS options.
Format
Shapefile / GeoJSON / GeoPackage
Geometry
Polygon
Coverage
European Union member states and candidate countries
Resolution
NUTS levels 0–3 (country to small region)
About this dataset
EU NUTS (Nomenclature of Territorial Units for Statistics) boundary polygons at levels 0–3 covering all EU member states for European statistical mapping.
Eurostat NUTS Boundaries provide the official European Union territorial classification system as boundary polygons at NUTS levels 0 (countries), 1 (major socio-economic regions), 2 (basic regions for EU policies), and 3 (small regions for specific diagnoses). The boundaries are maintained by Eurostat GISCO and are the standard reference for EU statistical mapping, regional policy analysis, and choropleth visualizations of European data.
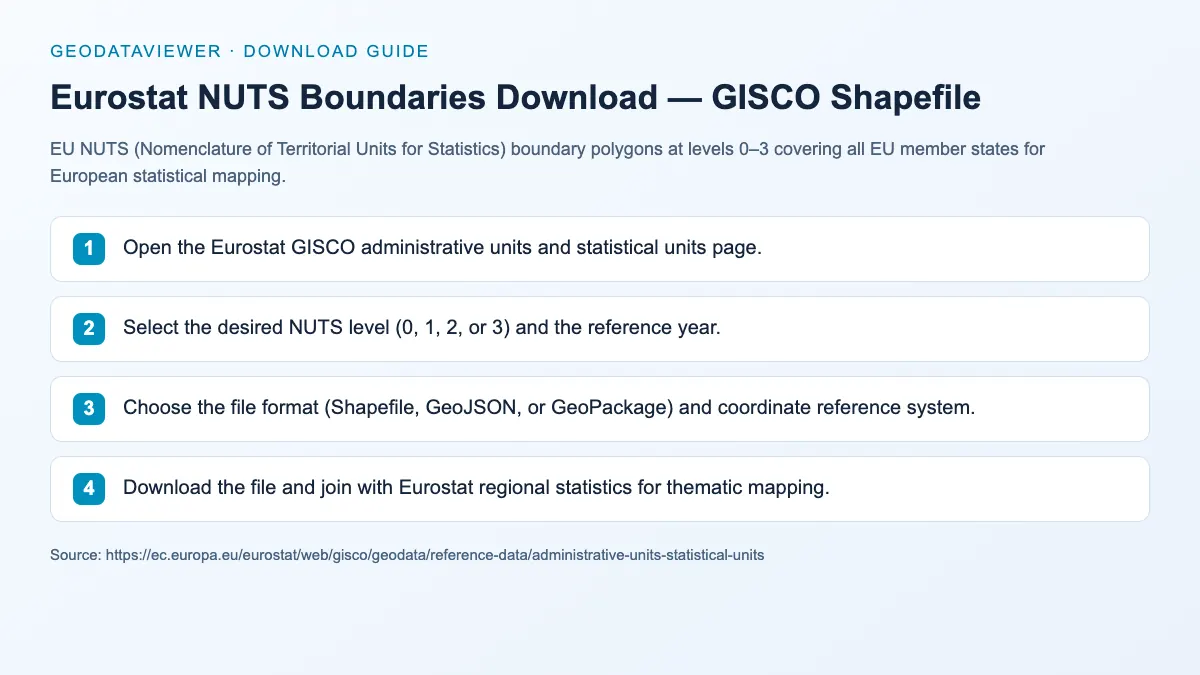
Download steps from this dataset’s GeoDataViewer guide. Follow the original provider for current files and access requirements.
How to download
- 1 Open the official GISCO NUTS page and choose the classification version stated in your statistical table metadata.
- 2 Select polygon geometry, the map scale, file format, and CRS. GeoJSON in EPSG:4326 is convenient for a geographic web-map preview.
- 3 Download the file and filter LEVL_CODE to the required level (0, 1, 2, or 3). Keep all sidecars together for a Shapefile ZIP.
- 4 Join the statistical table's regional code to NUTS_ID and inspect unmatched codes before creating the thematic map.
FAQ
What do NUTS levels 0–3 mean?
NUTS 0 = countries, NUTS 1 = major socio-economic regions, NUTS 2 = basic regions for EU policy, NUTS 3 = small regions for specific diagnoses. Each level offers finer granularity within the EU territorial classification system.
Which NUTS year should I use?
Use the classification version specified in the statistical table metadata. The observation year alone may not identify that version: a historical series can be reported using a later classification. Check for renamed, split, merged, or unmatched codes before joining.
How do I join Eurostat statistics to NUTS boundaries?
Filter the boundary layer to the required LEVL_CODE and join the table's regional code, often named geo, to NUTS_ID. Use the same classification version, keep codes as text, and review unmatched rows. NUTS level controls the regional hierarchy; map scale controls geometric detail.